Divergence in stock trading refers to the discrepancy between the movement of a stock’s price and the movement of a technical indicator, such as the Relative Strength Index (RSI) or the Moving Average Convergence Divergence (MACD) indicator. This is known as divergence when the stock’s price is trending in one direction, and the indicator is trending in the opposite direction.
The Relative Strength Index (RSI) divergence technical indicator is a popular tool traders use to analyze the financial market. It is a momentum indicator that compares the magnitude of recent gains to recent losses in an attempt to determine overbought and oversold conditions of an asset.
To use the RSI divergence indicator to analyze the financial market, traders first need to calculate the RSI. This is done by dividing the average of the gains over a certain period by the average of the losses over the same period. The result is then multiplied by 100, which gives the RSI value. The RSI value ranges from 0 to 100, where above 70 indicates an overbought condition and readings below 30 indicate an oversold condition.
After the RSI is calculated, traders can look for divergence between the RSI and the price action of the stock. Divergence occurs when they are moving in opposite directions. For example, if the price is trending upward, but the RSI is trending downward, this is considered a bearish divergence and may indicate a potential reversal in the trend. Traders can use this bearish divergence as a signal to enter a short position or to exit a long position. On the other hand, if the price is trending downward but the RSI is trending upward, this is considered a bullish divergence and may indicate a potential reversal. Traders can then use this bullish divergence as a signal to enter a long position or exit a short position.
Another important aspect of using the RSI divergence indicator is the time frame of the chart. The RSI divergence can occur on different time frames, such as daily, weekly, or monthly charts. Traders can use different time frames to get a broader perspective of the market trend and to identify potential reversals.
the RSI divergence indicator works best in trending markets. The RSI divergence signals may be less reliable in a range-bound market, where the price action is moving between support and resistance levels. In such cases, traders should consider using other indicators that are better suited for range-bound markets such as the Moving Average Convergence Divergence (MACD) or support and resistance levels.
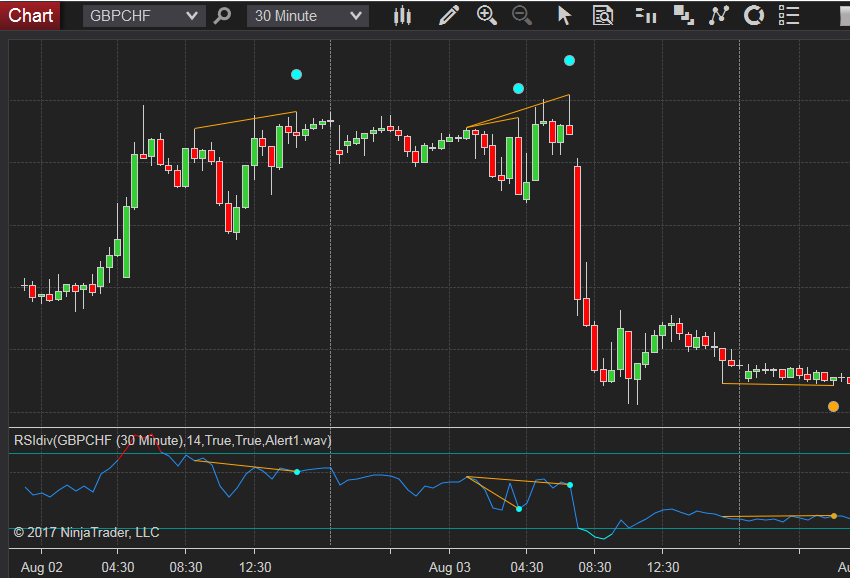
The pic below is our RSI divergence indicator with alert for NinjaTrader 8.
.png)
Another way to use the RSI divergence indicator is to combine it with other indicators to confirm the signal. For example, traders can use the RSI divergence in combination with the Moving Average (MA) indicator to confirm the signal. If the RSI divergence and the MA indicator are pointing in the same direction, it increases the probability of a potential reversal.
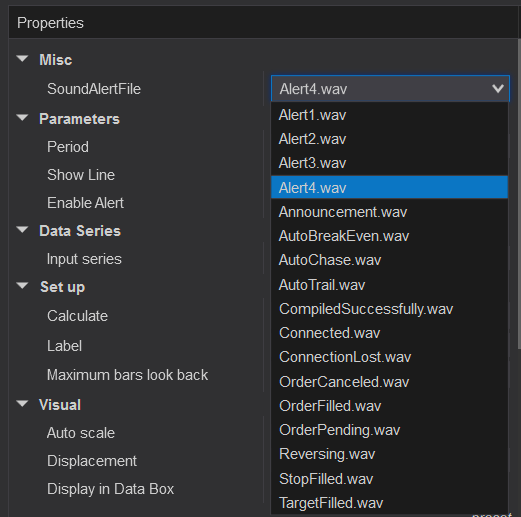
The pic below is our RSI divergence indicator with alert for NinjaTrader 8.
.png)
The duration of the divergence is another key point to consider. A long-term divergence, which lasts for several weeks or months, is more significant than a short-term divergence, which lasts for just a few days. This is because a long-term divergence indicates a strong change in momentum, while a short-term divergence may be just a temporary correction. Additionally, traders should also consider the market conditions when interpreting the RSI divergence. A strong divergence in a strong market trend is a more reliable signal than a weak divergence in a weak market trend.
One of the main limitations is that it does not consider the volume. Therefore, traders should take into account the volume when interpreting the RSI divergence signal. A divergence signal accompanied by high volume is more significant than a divergence signal accompanied by low volume. Also, in times when the divergence is subtle, the traders must use discretion when interpreting the signal, such as trendlines and chart patterns, to help confirm the signal.
In conclusion, the RSI divergence indicator is a powerful tool that traders can use to analyze the financial market. By monitoring the discrepancy between the RSI and the price action of an asset, traders can make more informed decisions. However, it is important to consider the duration of the divergence, market conditions, other forms of analysis and the volume to confirm the signal before making a trade. Further, traders should not rely solely on the RSI divergence indicator to make trading decisions. When analyzing the market, traders should also consider other indicators such as moving averages, Fibonacci retracements, and support and resistance levels combined with fundamental factors such as economic events and company news.
source: https://cmtassociation.org/kb/relative-strength-index-rsi/
It is important to note that divergence is not a guarantee of a reversal; it is just a signal that one may occur. Therefore, traders should always use other forms of analysis, such as fundamental analysis and chart patterns, to confirm the signal before making a trade. For example,
In conclusion, divergence is a powerful signal that traders can use to identify potential reversals in a stock’s trend. By monitoring the discrepancy between a stock’s price and a technical indicator, traders can make informed decisions about when to enter and exit trades. However, it is vital to use divergence in conjunction with other forms of analysis to confirm the signal before making a trade.
Source: https://cmtassociation.org/kb/relative-strength-index-rsi/