What is MACD Divergence?

MACD Divergence: A Powerful Tool for Market Analysis

In the world of technical analysis, the Moving Average Convergence Divergence (MACD) divergence is a widely utilized and well-regarded indicator in the world of trading. It provides traders with valuable insights and enables them to make knowledgeable trading decisions. This indicator combines trend following and momentum-based signals to identify potential price trend reversals and trend continuation. This article will discuss the basics of MACD divergence and how traders use it to analyze the market.

What is MACD Divergence?

MACD divergence is a technical analysis tool that compares the price action of an asset to the behavior of its underlying momentum indicator, the MACD. When the price of an asset is making higher highs, but the MACD is making lower highs, it is said to be showing positive divergence. Conversely, when the price of an asset is making lower lows, but the MACD is making higher lows, it is considered a negative divergence.

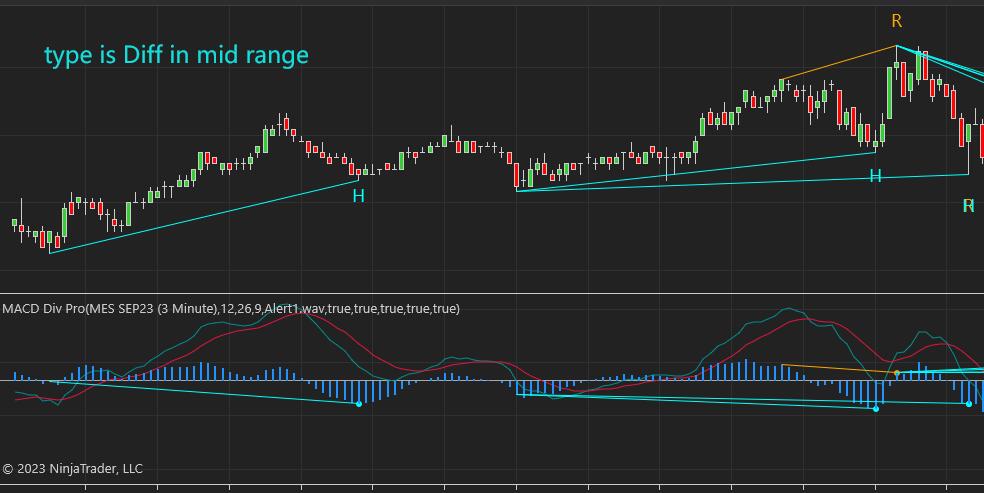
The pic below is from our MACD divergence indicator with alert for NinjaTrader 8.

How Traders Use MACD Divergence

Traders use MACD divergence as a signal to buy or sell an asset based on the trend reversal or continuation of the price. Positive divergence indicates that the underlying momentum of the asset is bullish, suggesting that the price is likely to continue to rise. Negative divergence, on the other hand, suggests that the momentum is bearish, and the price is expected to keep dropping.

Another consideration for traders is the use of different types of MACD divergence, such as regular divergence and hidden divergence. In contrast to regular divergence, where the price of an asset and the MACD move in opposite directions, hidden divergence occurs when the price and the MACD move in the same direction but at varying speeds. Traders can also use hidden divergence to identify the potential continuation of a trend.

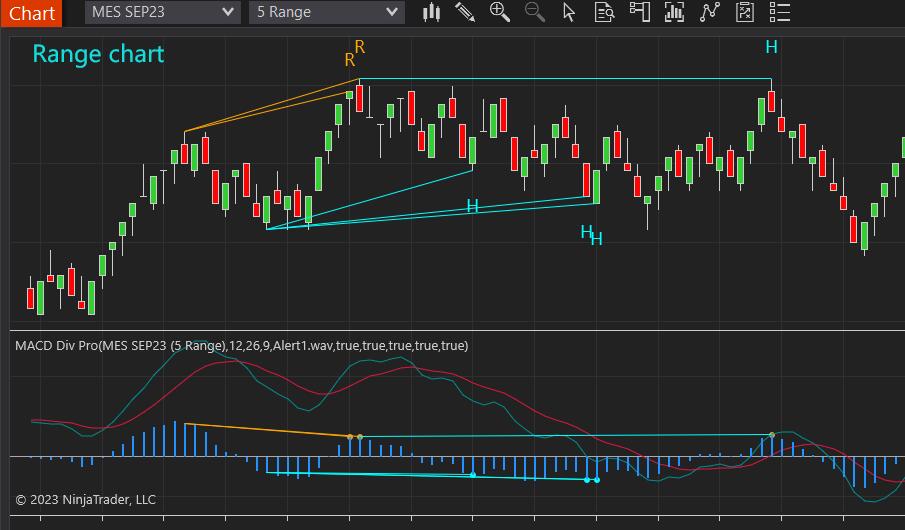
The pic below is from our MACD divergence indicator with alert for NinjaTrader 8.

Limitations

While the MACD divergence indicator can be useful in identifying market trends, it may also generate false signals, particularly in sideways markets. It is also sensitive to time frames and the selection of Moving average lengths. Different time frame settings can provide different signals, so it is wise to choose proper time frame that fits the trader’s trading style and market outlook. Lastly, like any other technical analysis tool, the MACD divergence indicator should not be relied upon as a standalone indicator but to be used together with other technical indicators, fundamental analysis, and risk management strategies.

Conclusion

The MACD divergence indicator is a crucial asset for traders seeking to make informed decisions in the financial market. By using a combination of tools and understanding different types of MACD divergence, traders can use this indicator to their advantage and succeed in the market.

Relative Strength Index (RSI) divergence indicator

Divergence in stock trading refers to the discrepancy between the movement of a stock’s price and the movement of a technical indicator, such as the Relative Strength Index (RSI) or the Moving Average Convergence Divergence (MACD) indicator. This is known as divergence when the stock’s price is trending in one direction, and the indicator is trending in the opposite direction.
The Relative Strength Index (RSI) divergence technical indicator is a popular tool traders use to analyze the financial market. It is a momentum indicator that compares the magnitude of recent gains to recent losses in an attempt to determine overbought and oversold conditions of an asset.
To use the RSI divergence indicator to analyze the financial market, traders first need to calculate the RSI. This is done by dividing the average of the gains over a certain period by the average of the losses over the same period. The result is then multiplied by 100, which gives the RSI value. The RSI value ranges from 0 to 100, where above 70 indicates an overbought condition and readings below 30 indicate an oversold condition.


After the RSI is calculated, traders can look for divergence between the RSI and the price action of the stock. Divergence occurs when they are moving in opposite directions. For example, if the price is trending upward, but the RSI is trending downward, this is considered a bearish divergence and may indicate a potential reversal in the trend. Traders can use this bearish divergence as a signal to enter a short position or to exit a long position. On the other hand, if the price is trending downward but the RSI is trending upward, this is considered a bullish divergence and may indicate a potential reversal. Traders can then use this bullish divergence as a signal to enter a long position or exit a short position.
Another important aspect of using the RSI divergence indicator is the time frame of the chart. The RSI divergence can occur on different time frames, such as daily, weekly, or monthly charts. Traders can use different time frames to get a broader perspective of the market trend and to identify potential reversals.
the RSI divergence indicator works best in trending markets. The RSI divergence signals may be less reliable in a range-bound market, where the price action is moving between support and resistance levels. In such cases, traders should consider using other indicators that are better suited for range-bound markets such as the Moving Average Convergence Divergence (MACD) or support and resistance levels.

The pic below is our RSI divergence indicator with alert for NinjaTrader 8.

Another way to use the RSI divergence indicator is to combine it with other indicators to confirm the signal. For example, traders can use the RSI divergence in combination with the Moving Average (MA) indicator to confirm the signal. If the RSI divergence and the MA indicator are pointing in the same direction, it increases the probability of a potential reversal.

The pic below is our RSI divergence indicator with alert for NinjaTrader 8.


The duration of the divergence is another key point to consider. A long-term divergence, which lasts for several weeks or months, is more significant than a short-term divergence, which lasts for just a few days. This is because a long-term divergence indicates a strong change in momentum, while a short-term divergence may be just a temporary correction.  Additionally, traders should also consider the market conditions when interpreting the RSI divergence. A strong divergence in a strong market trend is a more reliable signal than a weak divergence in a weak market trend.


One of the main limitations is that it does not consider the volume. Therefore, traders should take into account the volume when interpreting the RSI divergence signal. A divergence signal accompanied by high volume is more significant than a divergence signal accompanied by low volume. Also, in times when the divergence is subtle, the traders must use discretion when interpreting the signal, such as trendlines and chart patterns, to help confirm the signal.

In conclusion, the RSI divergence indicator is a powerful tool that traders can use to analyze the financial market. By monitoring the discrepancy between the RSI and the price action of an asset, traders can make more informed decisions.  However, it is important to consider the duration of the divergence, market conditions, other forms of analysis and the volume to confirm the signal before making a trade. Further, traders should not rely solely on the RSI divergence indicator to make trading decisions. When analyzing the market, traders should also consider other indicators such as moving averages, Fibonacci retracements, and support and resistance levels combined with fundamental factors such as economic events and company news.

source: https://cmtassociation.org/kb/relative-strength-index-rsi/
 

It is important to note that divergence is not a guarantee of a reversal; it is just a signal that one may occur. Therefore, traders should always use other forms of analysis, such as fundamental analysis and chart patterns, to confirm the signal before making a trade. For example,
In conclusion, divergence is a powerful signal that traders can use to identify potential reversals in a stock’s trend. By monitoring the discrepancy between a stock’s price and a technical indicator, traders can make informed decisions about when to enter and exit trades. However, it is vital to use divergence in conjunction with other forms of analysis to confirm the signal before making a trade.

Source: https://cmtassociation.org/kb/relative-strength-index-rsi/


Compare MT4 and MT5

MT4 vs MT5: Key Differences in the Popular Trading Platforms

In online trading, MetaTrader 4 (MT4) and MetaTrader 5 (MT5) stand as two of the most influential platforms. Developed by MetaQuotes Software, these platforms have offered many traders worldwide a powerful means to participate in the financial markets. But despite their similar names and common developer, MT4 and MT5 cater to different needs and have distinct features. Here’s an analysis of the differences between these two platforms.


Historical Context

MT4, released in 2005, was designed predominantly for forex trading. Owing to its ease of use, flexibility, and ability to support automated trading systems (known as Expert Advisors), MT4 quickly gained popularity among both novice and seasoned forex traders.

In 2010, MetaQuotes introduced MT5 as a successor to MT4, with an aim to extend the offerings beyond Forex to include other securities like stocks and commodities. However, MT5 hasn’t entirely eclipsed MT4, mainly due to the latter’s established user base and compatibility with a vast number of custom scripts and indicators.

Supported Markets

While MT4 was primarily built for Forex trading, MT5 was designed with expanded access to other markets. MT5 enables trading in stocks, futures, options and commodities, in addition to Forex. This extended asset class support in MT5 is particularly appealing to traders who prefer a diversified investment portfolio.

Order Types

MT4 supports three types of orders: market, stop, and limit. On the other hand, MT5 introduces two additional order types: ‘Buy Stop Limit’ and ‘Sell Stop Limit’. The added complexity of these additional order types, coupled with partial order filling policies, allows for the implementation of more nuanced strategies, thereby providing traders with increased control over the order execution.

Technical Analysis and Features

MT4 provides 30 built-in indicators, whereas MT5 offers 38. Furthermore, MT5 has 44 graphical objects compared to MT4’s 31. MT5 also supports 21 timeframes, a significant expansion from MT4’s 9. These enhancements in MT5 provide traders with a more detailed view of the market. MT5 also comes with features such as Market Depth, Time & Sales (Exchange data), and an Economic Calendar, none of which are offered by MT4.

Programming Language and Automated Trading

MT4 uses MQL4 language for its Expert Advisors (automated trading systems), while MT5 uses MQL5. MQL5 is more versatile and efficient, allowing for more complex strategies, better backtesting, and even standalone applications. The capabilities of the MQL4 language were expanded in 2014, however, the programming language of the MT4 platform cannot be executed on the MT5 platform, which is disadvantageous for traders who want to upgrade. Recognizing the challenges that traders may face in moving from MT4 to MT5, especially due to the lack of direct compatibility between MQL4 and MQL5 scripts, we are proud to provide a specialized conversion service. We offer smooth conversion of customized MT4 indicators to MT5, enabling traders to utilize their personalized trading tools without having to rebuild from the ground up.

Performance

MT4 and 32-bit: The 32-bit architecture of MT4 means it can only effectively utilize 2-4GB of RAM, depending on the system’s configuration. This is usually enough for basic and intermediate trading, but when dealing with complex strategies, Expert Advisors (EAs), or indicators, a lack of memory can result in reduced performance.

MT5 and 64-bit: MT5, being a 64-bit application, can effectively utilize a much larger amount of system memory (theoretically up to 18.4 million TB, but practically limited by the actual RAM installed on the computer). This expanded memory usage allows for more complex calculations, the handling of more open trades, and the use of more data in your EAs and indicators.

However, please note that to take full advantage of the 64-bit MT5 platform, and you need to be running a 64-bit operating system on your computer. On a 32-bit operating system, MT5 would still work but will be limited by the memory constraints of the 32-bit system.

Strategy Tester

MT5 features a multi-threaded strategy tester, which allows it to utilize multiple CPU cores to expedite the optimization of an Expert Advisor. Therefore, with a high-performance computer, backtesting in MT5 can be significantly faster than in MT4. Additionally, MT5 provides access to a substantially larger volume of downloadable historical data compared to MT4. This advantage can greatly benefit backtesting strategies that rely heavily on historical data.

Community and Marketplace

Both platforms have online marketplaces where users can buy, sell, or rent trading robots, technical indicators, and other useful trading applications. MT4’s marketplace is more extensive, largely because of its longevity. That said, MT5’s marketplace has been growing steadily.

Conclusion

In conclusion, they actually differ in many features and target market positioning, so there’s not much significance in comparing the merits and demerits between the two platforms. The choice between MT4 and MT5 largely depends on individual trading needs. 

Reasons to choose MT4:

· Ease of Use: MT4’s interface is user-friendly, making it a preferred choice for beginner Forex traders.

· Established Community and compatibility with third-party scripts: MT4’s large, active user base results in abundant third-party plugins, scripts, and troubleshooting forums. Additionally, MT4’s compatibility with a wide range of third-party plugins and scripts allows users to extend the platform’s functionalities, automate trading strategies, and customize the user experience.

· Expert Advisors (EAs) and Custom Indicators: The availability of a wide array of custom tools developed by the MT4 community enhances the platform’s suitability for many traders.

Reasons to choose MT5:

· Expanded Market Access: MT5 offers extended access to various markets including stocks, futures, and commodities.

· Advanced Tools and Features: MT5 includes more order types, additional built-in indicators and graphical objects, a wider range of timeframes, a built-in economic calendar, and the Market Depth feature.

· Enhanced Strategy Testing: MT5’s strategy tester uses multiple CPU cores for faster backtesting and optimization. It also provides access to more historical data compared to MT4, making it beneficial for backtesting strategies.

Please contact us if you need to convert your MT4 indicator or EA to MT5.