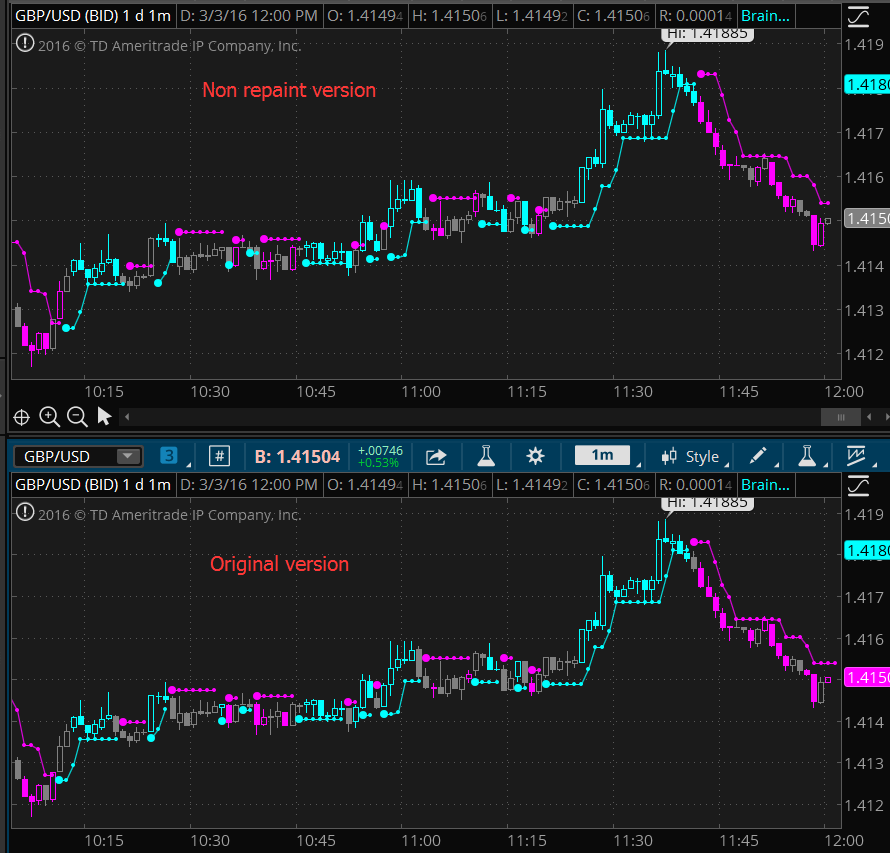
This is the NO REPAINT version with new algorithm, it also comes with alert.
In the original version, signal on current bar will always change until the Close price is fixed.
By NO REPAINT, it means the last/current signal will never change.
This Multi Time Frame (MTF) BrainTrend indicator has all features from (BrainTrend Indicator all-in-one edition). The only difference is that this version has Multi Time Frame (MTF) feature.
With this MTF version BrainTrend, you can apply any time frame of BrainTrend to your current chart.
As long as the selected MTF time frame is greater than the chart time frame.
Some examples of putting multiple time frames into use would be:
A swing trader, who focuses on daily charts for his or her decisions, could use weekly charts to define the primary trend and 60-minute charts to define the short-term trend.
A day trader could trade off of 15-minute charts, use 60-minute charts to define the primary trend and a five-minute chart (or even a tick chart) to define the short-term trend.
A long-term position trader could focus on weekly charts while using monthly charts to define the primary trend and daily charts to refine entries and exits.
Source: http://www.investopedia.com
BrainTrend is a very popular Indicator, the calculation is based on Stochastic Oscillator and Average True Range (ATR).
- Stochastic Oscillator is based on the observation that as prices increase, closing prices tend to be closer to the upper end of the price range. In downtrends, the closing price tends to be near the lower end of the range.
- ATR calculates the average of true price ranges over a time period. The True Price Range is defined as the greatest of distances between today’s high to today’s low, yesterday’s close to today’s high, and yesterday’s close to today’s low. The Average True Range is a moving average of the True Range over a specified period of time.
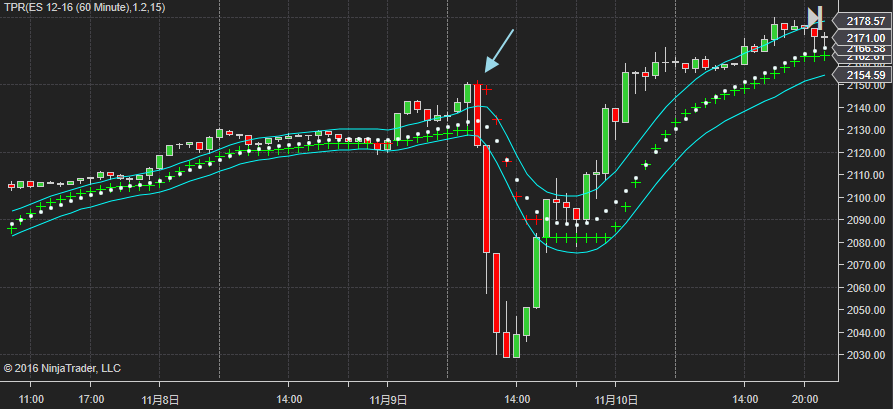
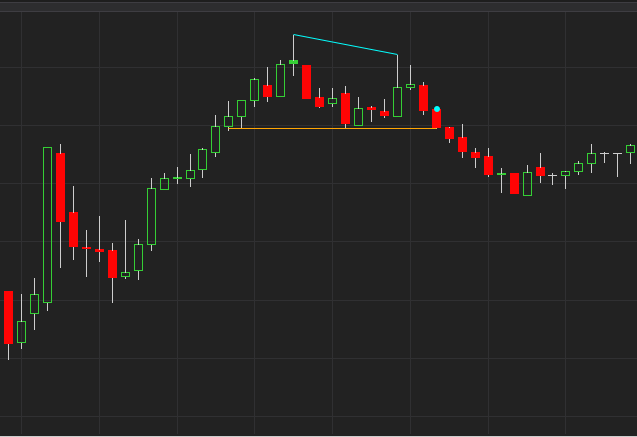
BrainTrend will provide a buy signal with a big Cyan dot when buy conditions are met. The value of the big cyan dot is the initial stop for the position. BrainTrend will provide a sell signal with a big Magenta dot when sell conditions are met. The value of the big dot is the initial stop for the position.
It shows trend direction by colors, when the market changes to or stays in an up-trend, the bars become or remain Cyan. When the market changes to or stays in a downtrend, the bars become or remain Magenta. When the market goes sideways or is not strong on either side, the bars become or remain Cyan.
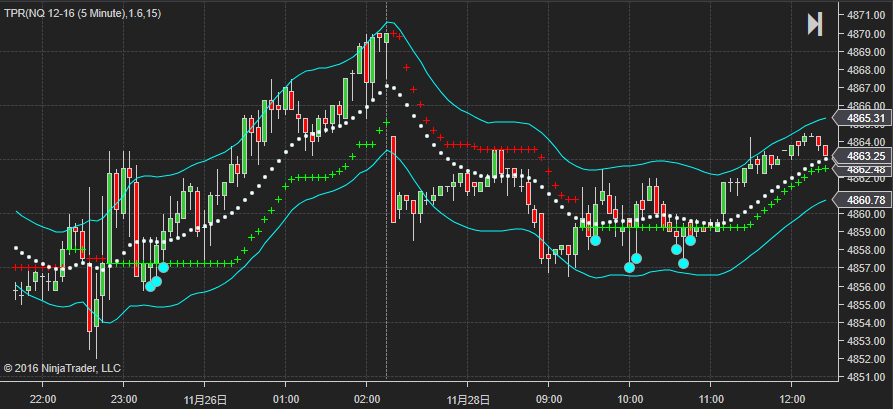
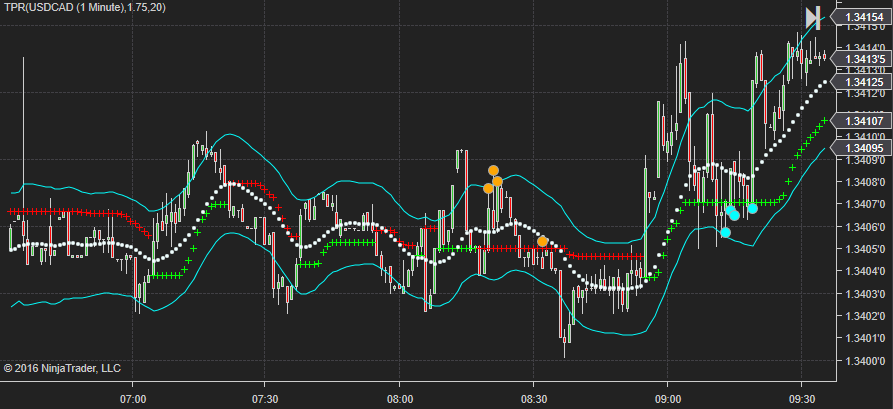
Cyan Dots below the lows of the bars indicate two things:
(1) the market is in an up-trend;
(2) the values of the Cyan Dots are the protection stops or the profit target stops (if the position had profit) for the long position.
The Magenta Dots above the highs of the bars indicate two things:
(1) the market is in a down-trend;
(2) the values of the Magenta Dots are the protection stops or the profit target stops (if the position had profit) for the short position.
Entry points are also effected by the settings of the time frame. The longer the time frame, the higher the accuracy. The time frame controls the trading frequency too.
Generally, use the longer time frame to determine the direction that you want to enter; use the shorter time frame to pinpoint the entry.

For example, you may use 1-hour chart to guide the direction and use 15-min chart for entry or exit for daytrading.
This method has a great advantage of getting better filled for position trading. Use the longer time frame, such as the 4-hour bar, to determine the direction, and use a short time frame, such as 1-hour or 30 minute, to determine the entry point. For example, if the 4-hour bar is cyan, prepare to buy, but wait for the 1-hour or 30 minute bar to turn Magenta. Estimate the normal retracement duration for your market. If the normal retracement duration is 4 bars on the 30 minute chart, then wait for 4 Magenta bars, and if the 4th Magenta bar does not penetrate the BrainTrade stop, enter a long position at the market. You get a better filled price as well as a favorable market position, since the market did not penetrate the stop after a normal retracement period. You may use 4-hour chart to guide the direction and use 1-hour chart for entry or exit for position trading. Wait the market pulling back, but not penetrating the BrainTrade stops to enter.
You need to decide for yourself, though typically the best time is about 4 to 8 bars. Avoid entering the market near the current high or long term Resistance Line, even when you get a buy signal from short term chart and confirmed by long-term chart.
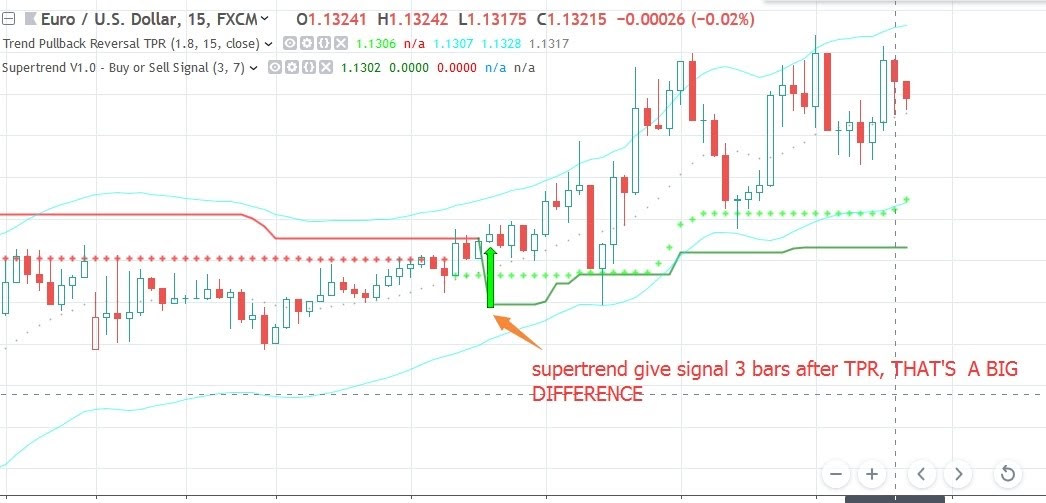
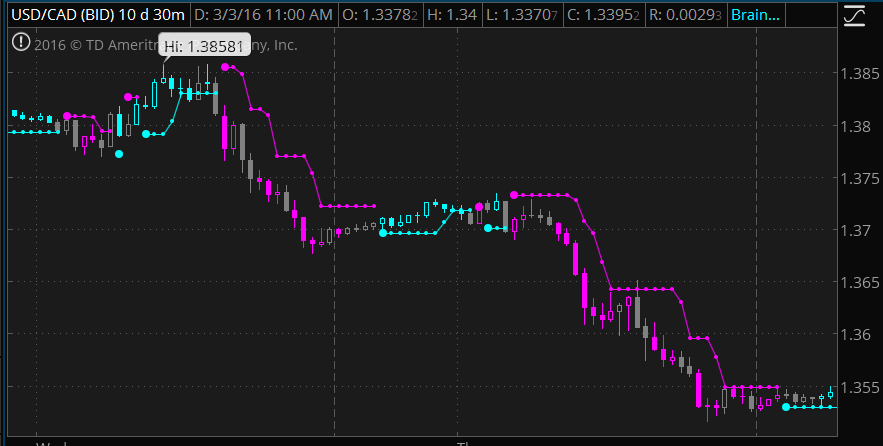
The following charts show how MTF works when you load a current timeframe indicator and a longer timeframe MTF indicator.
To do that, you need to load this indicator twice, and set one of them to MTF=no, and another with MTF=yes and choose your desired timeframe for it.


The trading tips revealed here are intended to enhance your winning probability. Any trading rules, however, have certain limitations based on which market you refer to, what kind of confirmations you are using, what time frame is being used, and so on. You need to test the rules with your specific market before applying to real trading. To apply BrainTrade indicators with consideration of different market conditions is very important.
BrainTrade is ideal for both day trading and position trading. BrainTrade help you to focus on the most essential information on markets. BrainTrade indicators provide market directions, provide trend and stops, provide buy and sell signals. With BrainTrade you now have immediate access to the river of information about the major trend changes, buy and sell signals, and stops for large number of market symbols. BrainTrade is revolutionizing the very nature of trading. People have lived for so long without information at their fingertips that they don’t realize what they’re missing.
Parameters available for you to adjust the BrainTrend Indicator.
- MTF: choose ‘yes’ to enable Multi Time Frame (MTF) on chart.
- timeframe: choos your desired timeframe.
- stoch_period
- stoch_max
- stoch_min
- atr_current_norm_factor
- atr_before_norm_factor
- atr_period
- atr_before_step
Since there already are many explaination and details about this indicator, we don’t repeat it here.
It works on all time frame(Tick, Minutes, Daily, Weekly, Monthly) and all markets(Stocks, Futures, Forex, Options,ETF, etc.)


The file will be sent to your email after the payment is cleared.